Graphs
Graphs are a non-linear data structure of nodes connected by edges (pointers to other nodes). Graphs create a network of nodes. While graphs can be intimidating as a data structure, they actually have many direct real-world applications that make them easier to visualize. Once you grasp the fundamentals, you will also likely find the questions can be easy.
This section will make sure you fully understand graphs by first learning them in a practical context, then moving to the most simple case in how we think about them in our code, and finally building from this into fully understanding everything you need to know for interviews.
Important terms:
- node (vertex) - an item in the graph
- edge - how nodes are connected to each other
Cheat Sheet
- Model RelationshipsGraphs are the best data structure to represent data/items/people that have complex relationships.
- ScalabilityMost graph algorithms are slow at O(V + E) [the number of vertexes + edges] or worse.
Graphs in Interviews
- Take an input node and be able to walk through a graph
- Traverse a graph using DFS vs. BFS and know the benefits of each method
- Understand or detect the corner cases: empty, one or two nodes, disconnected, cycles
- Handle graphs represented using other data structures such as a 2D matrix
- Find the shortest path between two nodes
- In a directed graph, determine if there is a path between nodes
- Search for nodes and start a new traversal from them if found
Graphs Explained
You may be thinking graphs look very similar to linked lists and trees, and you would be right! Linked lists and trees are implementations of graphs with specific constraints, so everything you learned in those sections will just be generalized here and built upon.
Real-World Examples
Before we dive, let's understand how we use graphs in the real world. With Twitter, at its most basic level, it is a bunch of user accounts that follow each other.
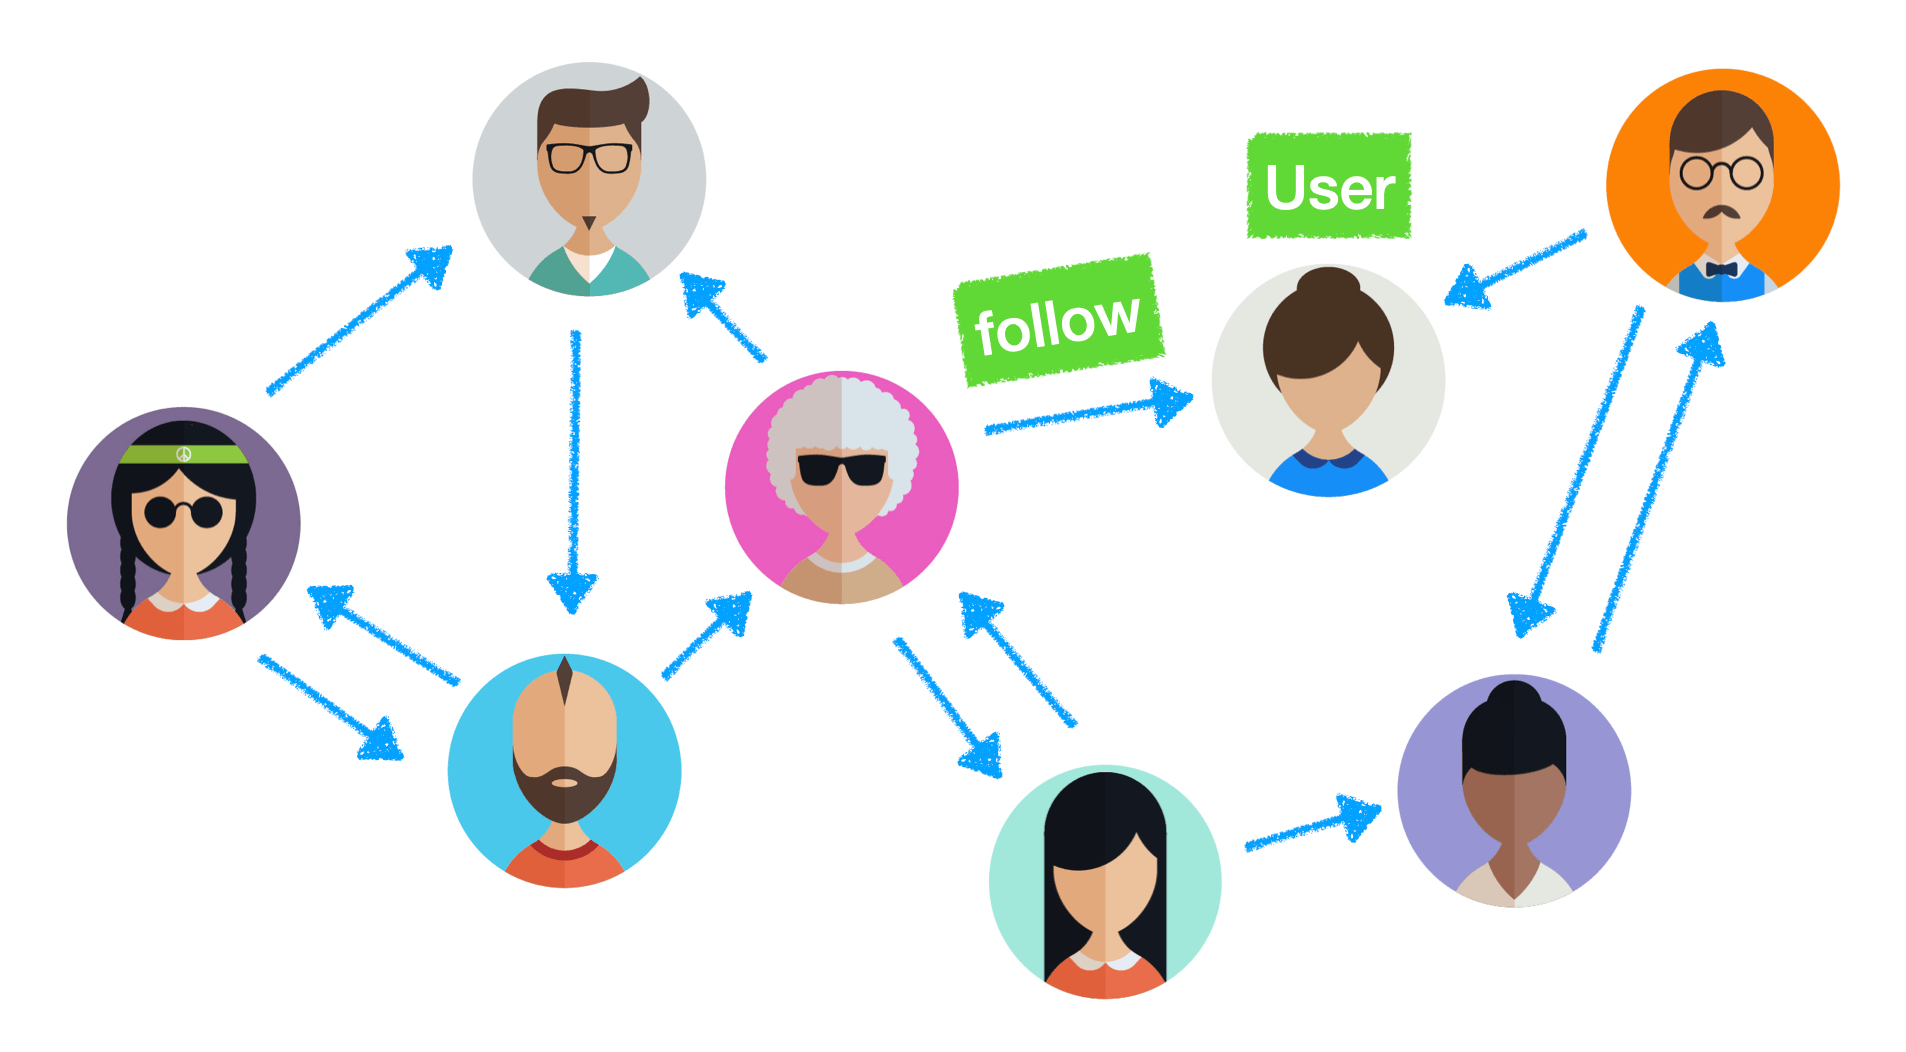
Each user is a node and the follower relationship is the edge that connects them. The types of relationships include:
- A single direction (a person follows another account, but the other person does not follow back)
- A bi-directional relationship where two accounts follow each other
- Clusters of friends where many people follow each other
- Indirectly connected through friends where neither person follows each other but there is a path from a mutual connection
- People who don't follow each other and have no friends in common
Viewing it as a graph we're more accustomed to:
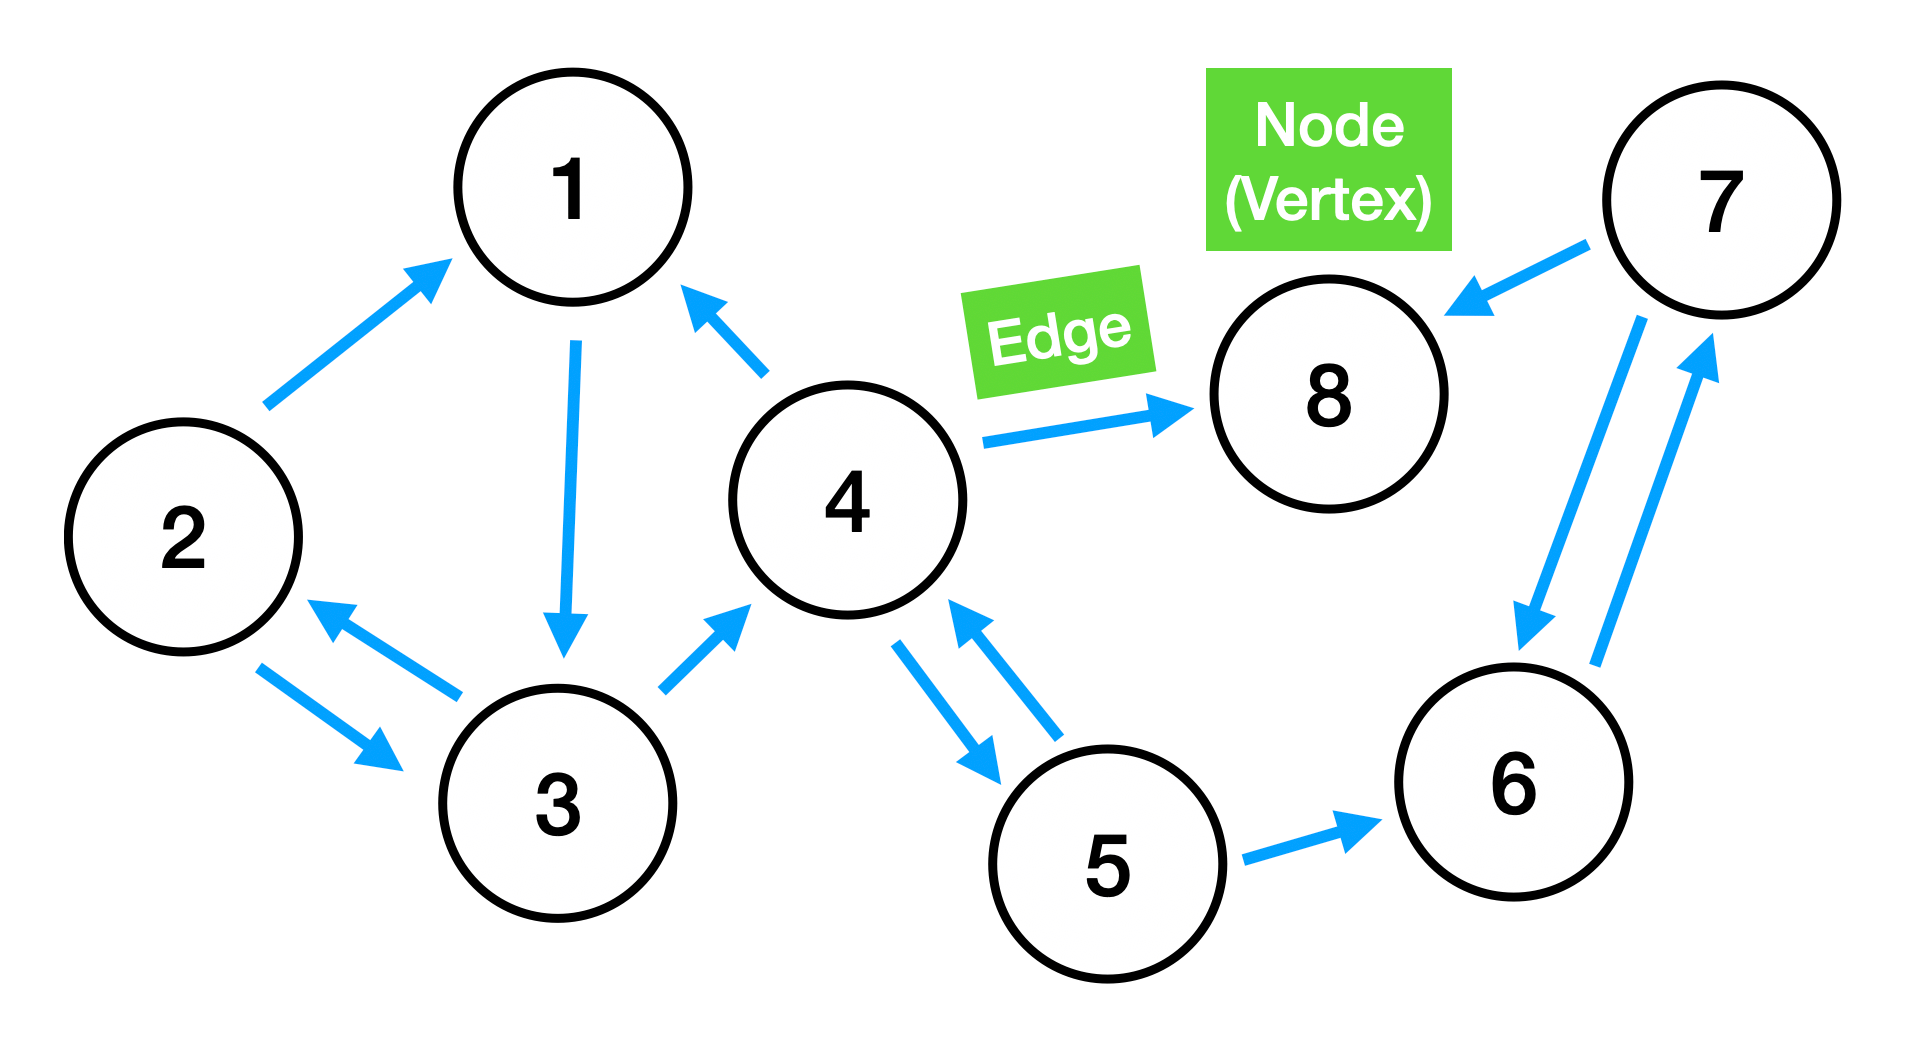
All of these cases directly translate to different constructions of graphs that you will learn about below.
Other examples of graphs include:
- Web pages (nodes) and being connected through hyperlinks
<a>(edges) - Google maps with the locations being nodes and the streets connecting them as edges
- Amazon product recommendations where they advertise items based on other people who bought similar goods
Types of Graphs
Graphs can be implemented with different constraints. Below are the most common you'll need for coding interviews.
Directed vs. Undirected
A directed graph means an edge specifies the direction that you must follow to traverse from one node from another. In the graph below, you can move from node 0 to node 1, but you can't directly go from node 1 to node 0.
An undirected graph means you can move in either direction between nodes as long as the edge exists. In the graph below, you can directly and freely move between node 0 and node 1 in either direction.
Cyclic vs. Acyclic
A cyclic graph is one that has a path that forms a loop. You can follow items along this path and eventually return to the original node without changing directions or going backward through nodes you had previously visited.
An acyclic graph means there are no cycles.
Connected vs. Disconnected
A connected graph is one where all nodes have a path between every other node.
A disconnected graph is one where there are multiple groups of nodes where there is no path connecting them. These are also called disjoint graphs.
Weighted vs. Unweighted
A weighted graph means there is a value assigned to each edge. For the solution, you may want to maximize or minimize the total weight of following a path.
For example, selecting your GPS route works as a weighted graph where an edge's weight would indicate the time between the locations (nodes). Not all routes are equal, and you want the path that requires the shortest time to travel between the destinations you want to visit. Google Maps would give you the path that minimizes the time (weight) to visit all the locations, which may or may not be the actual shortest path in distance because of other factors such as traffic.
An unweighted graph is what we've already been discussing where every edge is valued the same.
Traversing a Graph: DFS vs. BFS
Understanding breadth-first search (BFS) and depth-first search (DFS) is essential, and you should feel comfortable implementing both. We'll briefly introduce the concepts here, and then you can explore them further in their sections.
Depth-first search: DFS is implemented using a stack, and it goes as deep as it can down a path first and fully explores it before checking another. It goes deep before it goes wide. DFS is often more intuitive and can be easily implemented using recursion.
Breadth-first search: BFS is implemented using a queue and visits the closest nodes first. It explores neighbors before going to their children and goes wide before it goes deep. This is used to find the shortest past between nodes.
Often for graph interview questions, performing the traversal is half the battle. Then you just visit each node and utilize its data.
Representing a Graph
One way graphs are represented in interviews is to be given a starting node and then traverse the graph by following the edges.
It's also possible to represent graphs using other data structures like a hash table or matrix.
Adjacency List
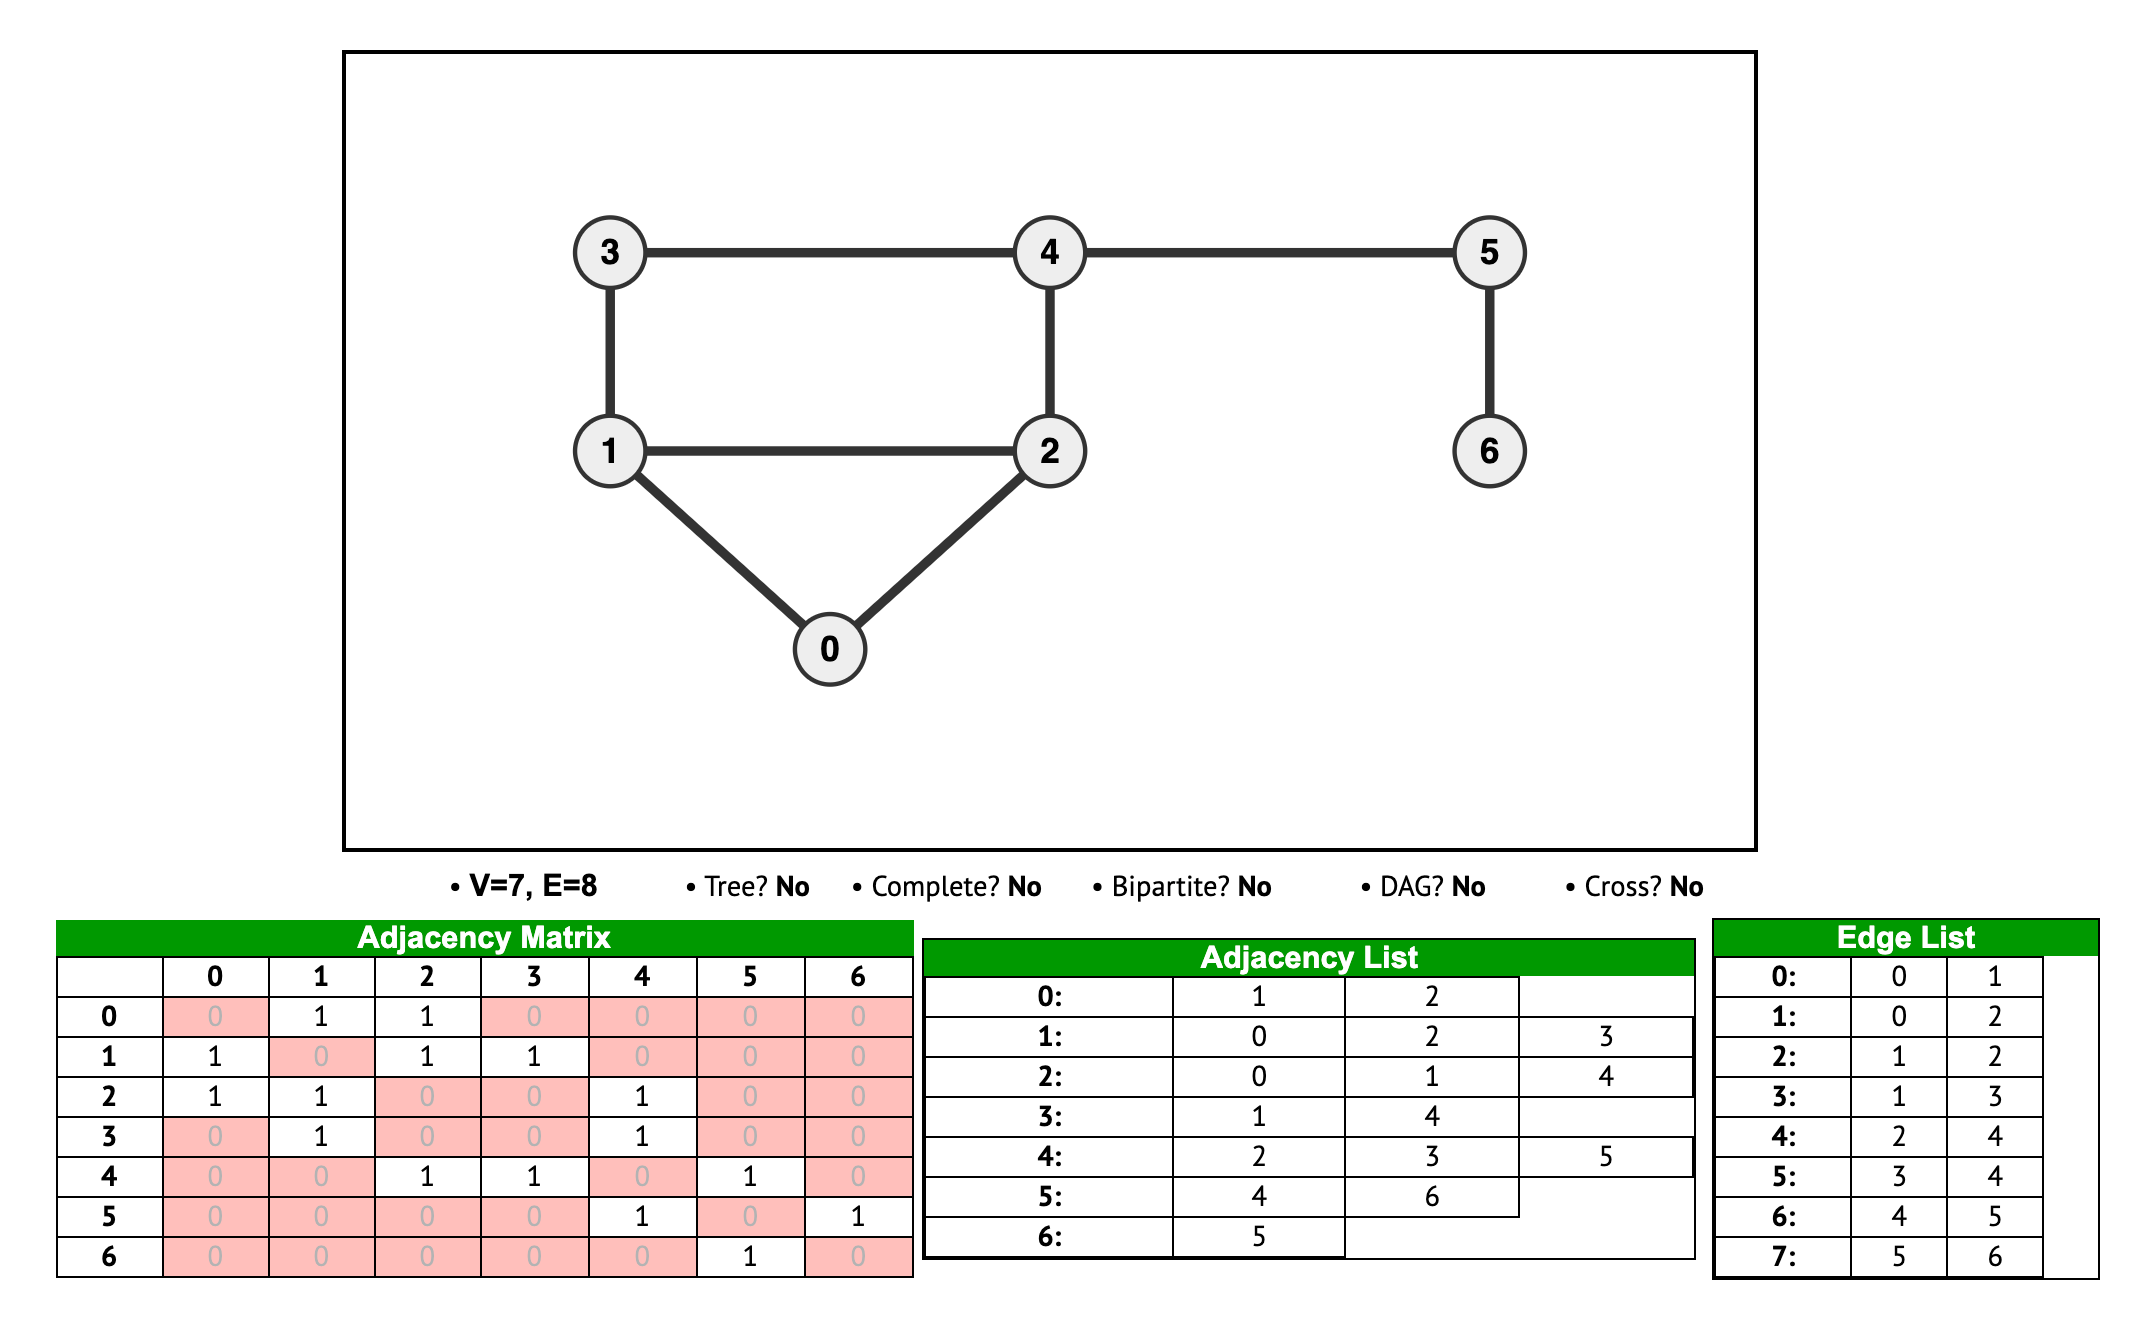
We'll use the following graph in our examples:
An adjacency list is one of the most common ways to represent a graph. A hash table is used where a key represents the individual nodes, and each key's value is an array of the neighbors connected to this node. So the array represents the edges for nodes connected to the current node.
Adjacency Matrix
An adjacency matrix has values where a 1 means there is a connection between nodes, and a 0 means there is not a connection.
The index of the row or column represents the node value.
Node 3 has an edge with nodes 1, 2, and 4.
So, adjacencyMatrixGraph[3][1], adjacencyMatrixGraph[3][2], adjacencyMatrixGraph[3][4] all equal 1.
Likewise, adjacencyMatrixGraph[1][3], adjacencyMatrixGraph[2][3], adjacencyMatrixGraph[4][3] all equal 1 (in addition to their other edges).
Edge List
An edge list contains arrays of two items where each array represents two nodes that share an edge.